RXBio Translates Sequence to Science and Industry

1 Ultra-high spatial resolution
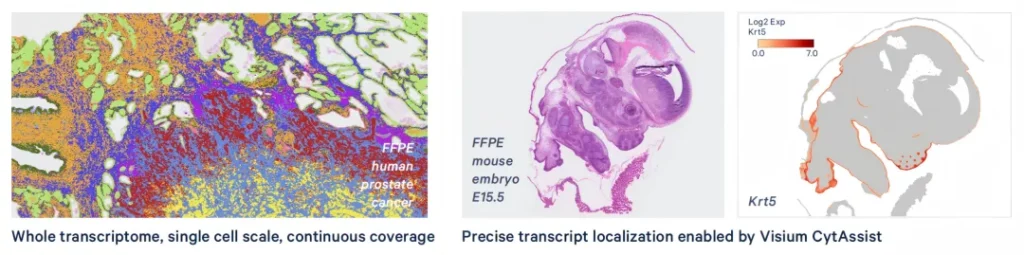
Through a continuous oligonucleotide array with a size of 2×2 μm, combined with the probe capture technology of the Visium CytAssist instrument, the diffusion of transcripts is restricted, and the precise positioning of transcripts is achieved.
2 Multi-tissue compatibility
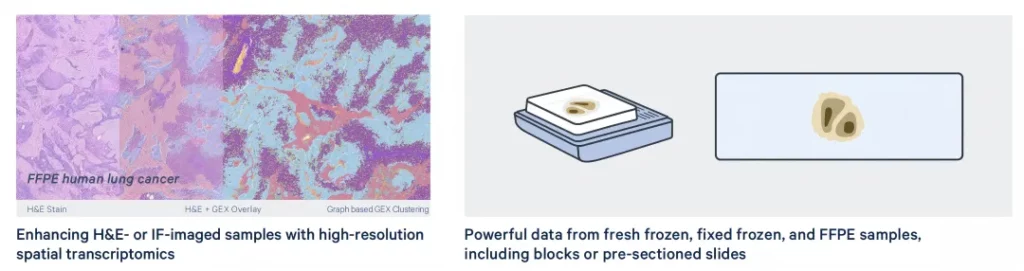
It is applicable to fresh frozen, fixed frozen and FFPE samples of humans or mice (including fresh sections, archived samples (stored at room temperature or 4 °C for 6 months) and mounted samples). It supports H&E staining and immunofluorescence staining. The high-resolution spatial transcriptomics technology for the same tissue slice can enhance the effects of H&E staining and immunofluorescence imaging.
3 Whole-transcriptome coverage
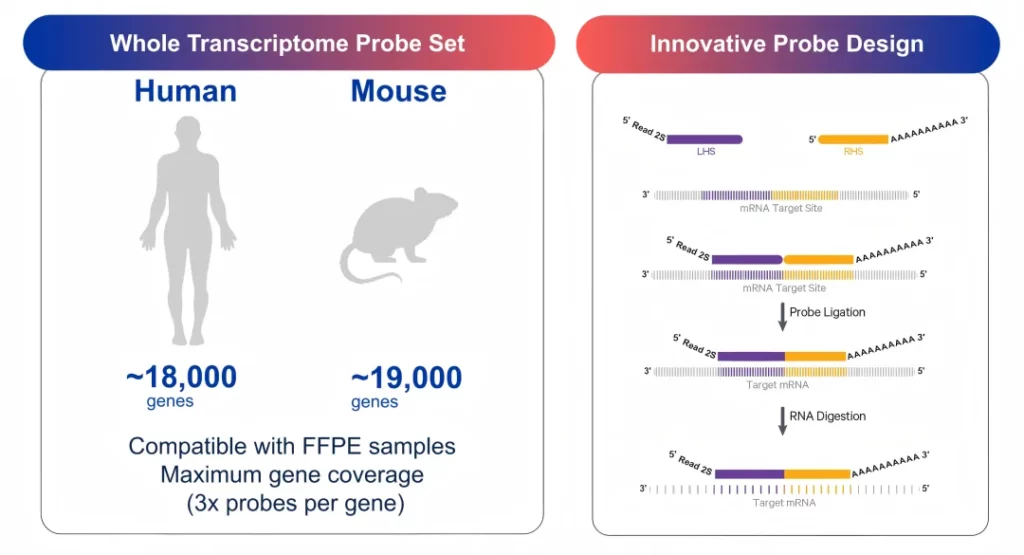
Using a probe-based detection method (RNA-templated ligation, RTL), it covers approximately 18,000 genes in humans and approximately 19,000 genes in mice. Three sets of probes are designed for each gene to improve the detection sensitivity.
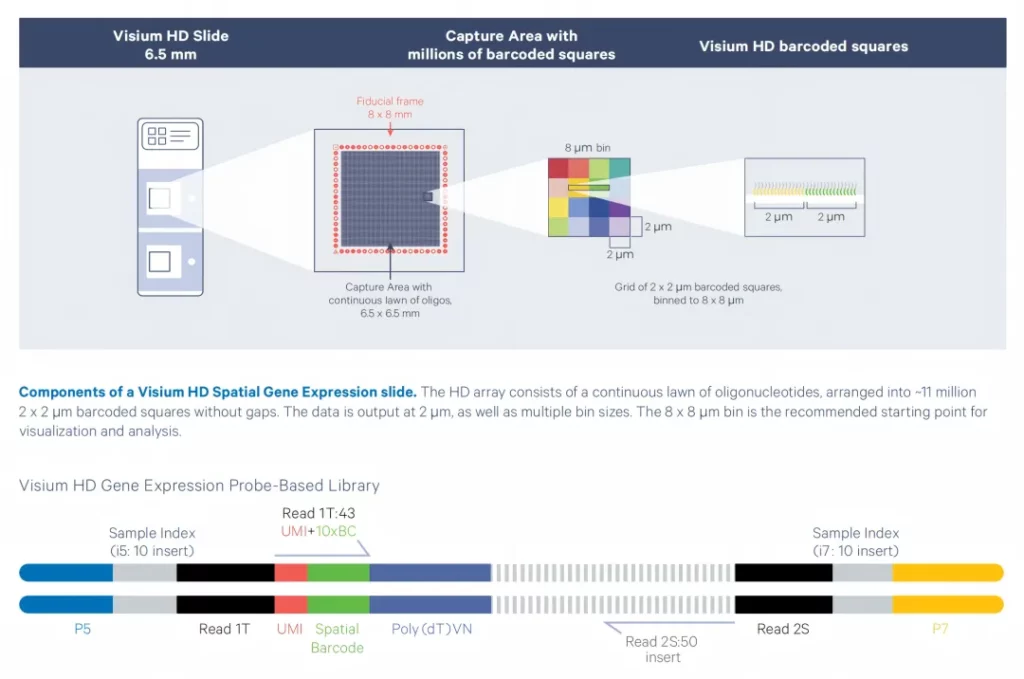
The Visium HD slide has two capture areas, with each area being 6.5 × 6.5 mm. And there is a fiducial frame around the capture areas for image alignment. The capture areas are arranged with continuous oligonucleotide arrays, which are composed of approximately 11 million 2 × 2 µm barcode squares. These squares are arranged continuously and without gaps, achieving whole-tissue coverage and single-cell level resolution. The oligonucleotides have the following features:
▶ 30 nt of poly(dT), which is used to capture the probe ligation products with a poly(A) tail through base complementary pairing.
▶ Unique Molecular Identifier (UMI): It is used to identify the duplicate molecules generated during the library preparation and sequencing processes.
▶ Spatial Barcode: Each 2 × 2 µm barcode square has a unique spatial barcode, which is used to label the spatial location information of transcripts.
▶ Illumina TruSeq Read 1 sequencing primer: It is used for library construction and paired-end sequencing.
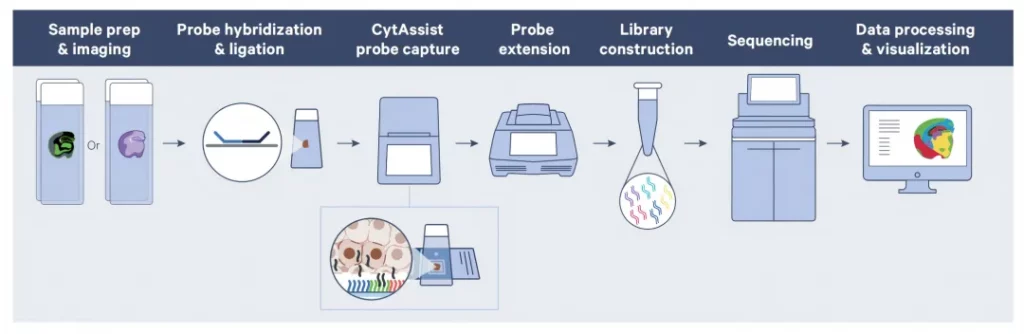
The preparation process of tissue sections includes tissue sectioning, dewaxing (applicable to FFPE tissues), staining and imaging on glass slides. Then, two tissue sections and one Visium HD slide containing two capture areas are placed into the CytAssist instrument, and the tissue sections are aligned with the two Visium capture areas. Inside the instrument, bright field images will be captured to provide spatial positioning for data analysis. Subsequently, the tissues are permeabilized and the transcriptome probes are transferred onto the Visium HD slide. After the probes are extended, the samples are eluted and transferred into new test tubes to construct a gene expression library. Finally, the resulting gene expression library will be sequenced.
Case 1
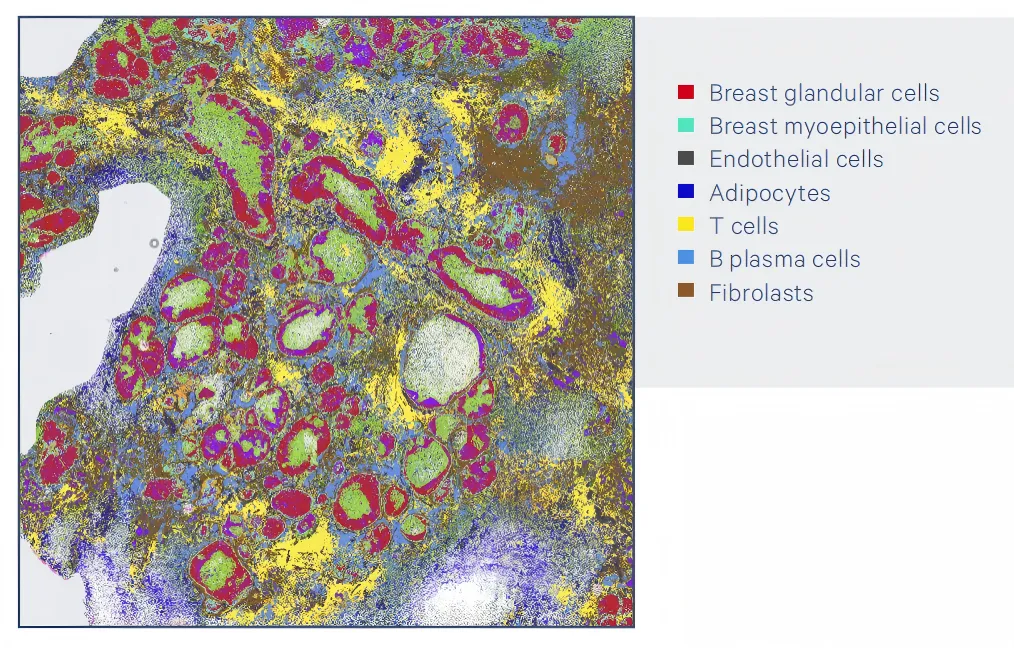
Visium HD analyzed this FFPE human breast cancer sample of ductal carcinoma in situ and constructed an unbiased whole-transcriptome map, and identified the main cell types and states in the tumor microenvironment.
Case 2
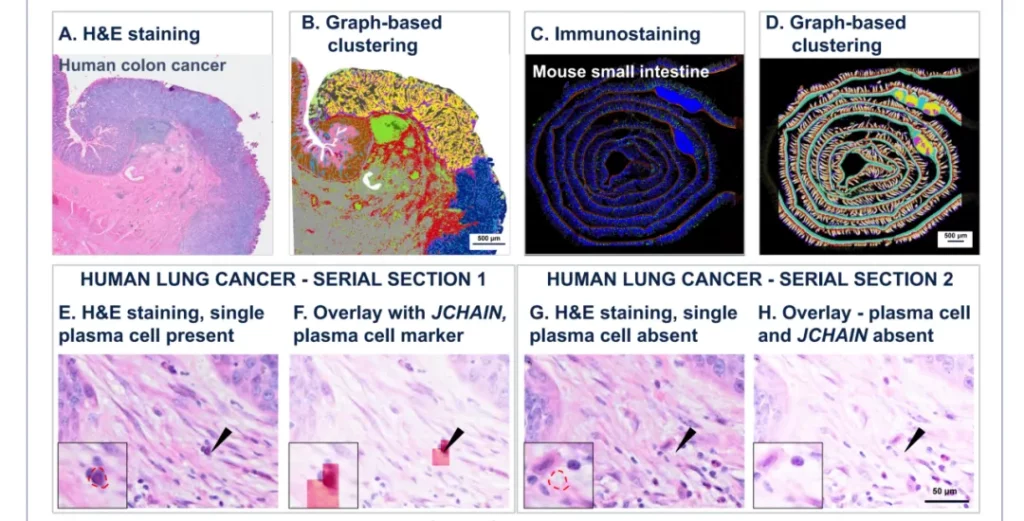
Histological and spatial analysis of the same tissue slice. A and B show H&E staining (A) and graph-based clustering (B) of the same human colon cancer slice respectively. C and D show the immunostaining of alpha-SMA (red), WGA (green) and DAPI (blue) (C) and graph-based clustering (D) of the same mouse small intestine slice respectively. The black arrows indicate the presence of a single plasma cell with JCHAIN expression in serial slice 1 (E, F); there is no plasma cell in serial slice 2 (G, H), and JCHAIN expression is also not expressed.
Case 3
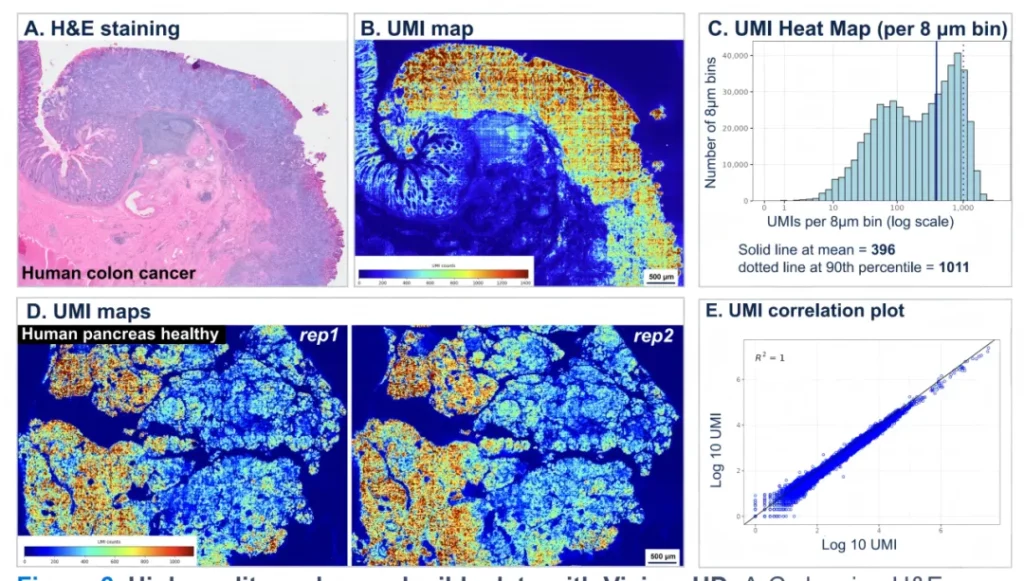
Use Visium HD to obtain high-quality and reproducible data. A – C show the H&E staining (A), UMI map (B) and UMI distribution map (C) of human colon cancer respectively. D and E show the UMI map (D) of two replicate samples of healthy human pancreas and the high correlation of UMI distribution between the replicate samples (E) respectively.
Case 4
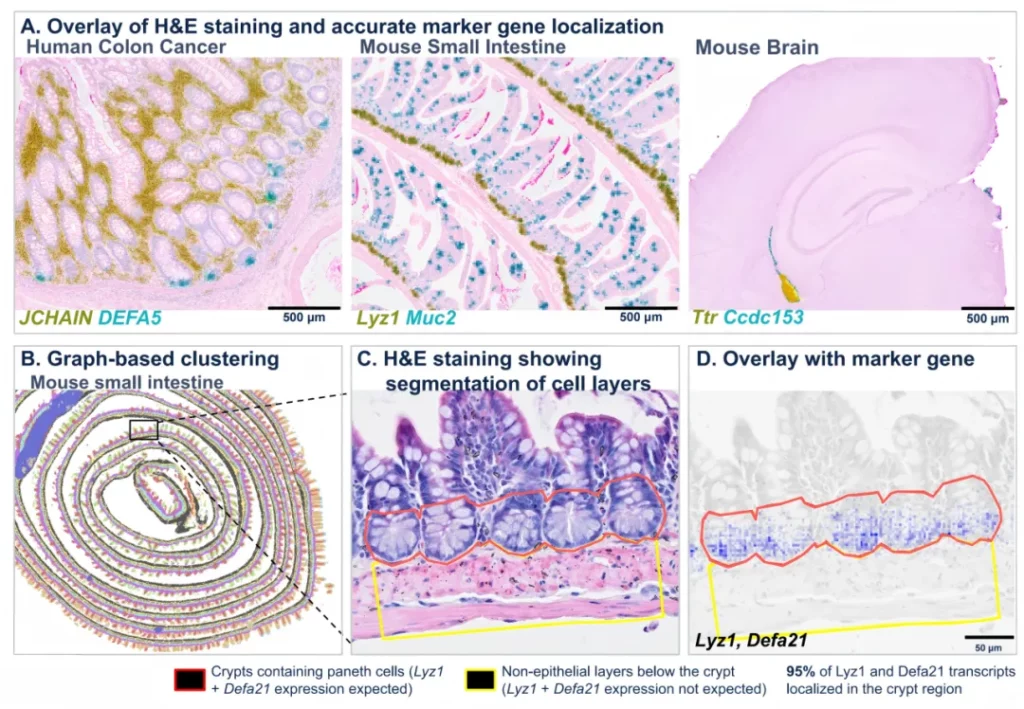
Use the Cytassist probe capture technology to achieve precise positioning of transcripts. The superimposition of H&E staining and the expression of marker genes shows the accurate positioning of transcripts at the expected positions (A). Graph-based clustering of the mouse small intestine (B). The area within the black frame in Figure E is enlarged to show the H&E staining (C), where the red area represents the crypt area that is expected to contain Paneth cells expressing Lyz1 and Defa21 transcripts, and the yellow area represents the adjacent muscle layer that does not express Paneth cell markers. The superimposition of H&E and Paneth cell marker genes (D). It is worth noting that approximately 95% of the Lyz1 and Defa21 transcripts are correctly positioned in the crypt area containing Paneth cells.
English Title: Granzyme K+ CD8+ T cells interact with fibroblasts to promote neutrophilic inflammation in nasal polyps
Journal: Nature Communications Publication
Time: November 2024
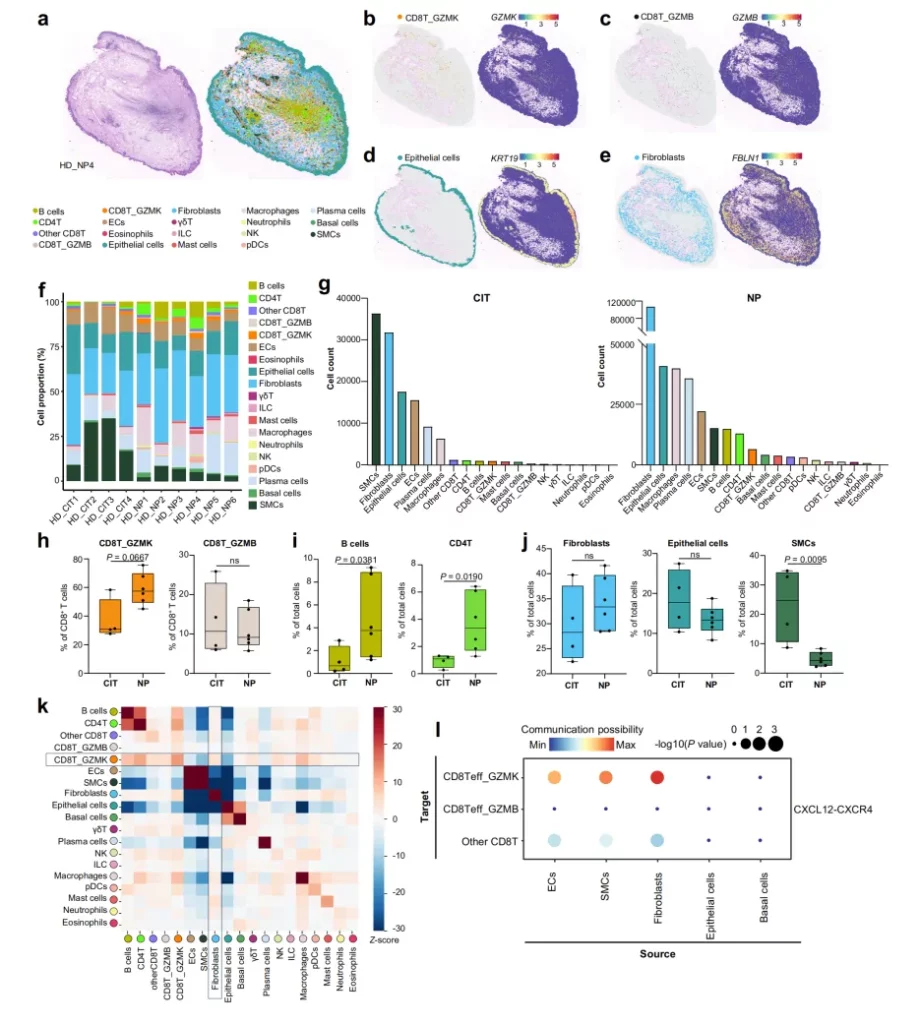
Research Objectives: Since the conventional Visium platform cannot achieve single-cell resolution (the detection spots with a size of 55 μm contain 1 – 10 cells), it is difficult to accurately analyze the interactions between cells. However, the Visium HD platform can provide spatial resolution at the single-cell scale (barcode squares with a size of 2 × 2 µm and without gaps). Therefore, the authors used this platform to analyze more samples in order to observe the spatial distribution of immune cells and structural cells in nasal tissues more precisely, and then reveal the interactions between cells, especially the relationship between GZMK⁺ CD8⁺ T cells and fibroblasts, so as to provide more powerful evidence for in-depth understanding of the pathogenesis of CRSwNP.
Research Results
-Cell Distribution and Composition: After analyzing 4 control samples and 6 nasal polyp (NP) samples, CD8T_GZMK and CD8T_GZMB cells were identified and visualized in the lamina propria of NP tissues. A large number of immune cells infiltrated in the NP group, among which the numbers of macrophages, plasma cells, B cells and CD4⁺ T cells were greater than that of CD8T_GZMK. Compared with the control inferior turbinate (CIT) group, the proportions of CD8T_GZMK, B cells and CD4⁺ T cells increased in the NP group, while the proportion of smooth muscle cells decreased significantly. However, the proportions of fibroblasts or epithelial cells did not change significantly.
-Cell-Cell Interactions: Neighborhood enrichment analysis was conducted using Squidpy, and it was found that there was a positive neighborhood enrichment relationship between CD8T_GZMK and fibroblasts, meaning that these two types of cells were closer in space, and this relationship was specific. Other immune cells did not show a stronger neighborhood enrichment relationship with fibroblasts. In addition, ligand-receptor analysis based on Visium HD data indicated that GZMK⁺ CD8⁺ T cells and fibroblasts communicated through the CXCR4-CXCL12 axis, further confirming the close connection between them.