RXBio Translates Sequence to Science and Industry

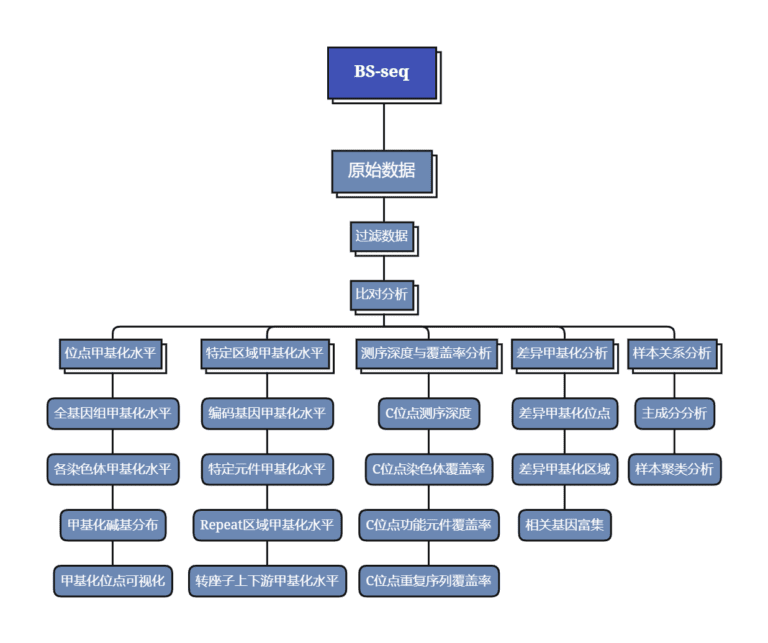
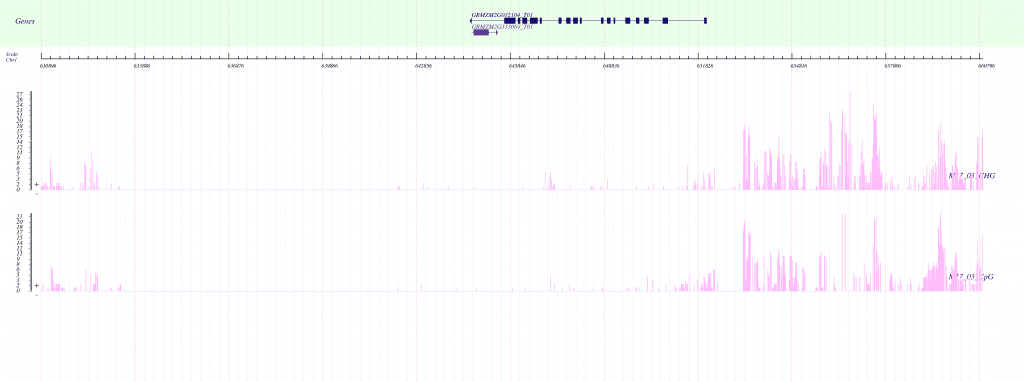
Bisulfite sequencing (BS-seq, also referred to as Bisulfite-seq or Methyl-Seq) is a method that uses bisulfite to treat DNA, enabling the study of the methylation status of cytosine at single-base resolution across the entire genome. The principle of BS-seq lies in the fact that bisulfite can convert cytosine (C) on DNA into uracil (U), while 5-methylcytosine, which has been methylated, remains unaffected. In this way, bisulfite treatment allows researchers to obtain specific base changes in the DNA sequence, thereby determining its methylation status. After obtaining the DNA sequence information following bisulfite treatment, a variety of analytical methods can acquire DNA methylation information by reading the sequence data and performing genomic alignment. The goal of such analyses is to distinguish the single-nucleotide polymorphisms (cytosine and thymine) caused by bisulfite treatment, so as to determine the methylation status of genomic DNA and correlate it with biological significance.
✔ Provide personalized solutions for different research fields;
✔ Offer a comprehensive analysis workflow, detailed data interpretation, and personalized analysis for post-data mining;
✔ Boast abundant research approaches: mapping DNA methylation modifications and tracking changes of modified sites during developmental processes; identifying differences in methylation modification profiles and modified sites between disease and control groups; and combining with data from ChIP-seq, RNA-seq, etc., to reveal the functions of methylation-modified sites.
▶ Loss of 5-hydroxymethylcytosine is linked to gene bodyhypermethylation in kidney cancer (Cell Res. IF = 46.297).
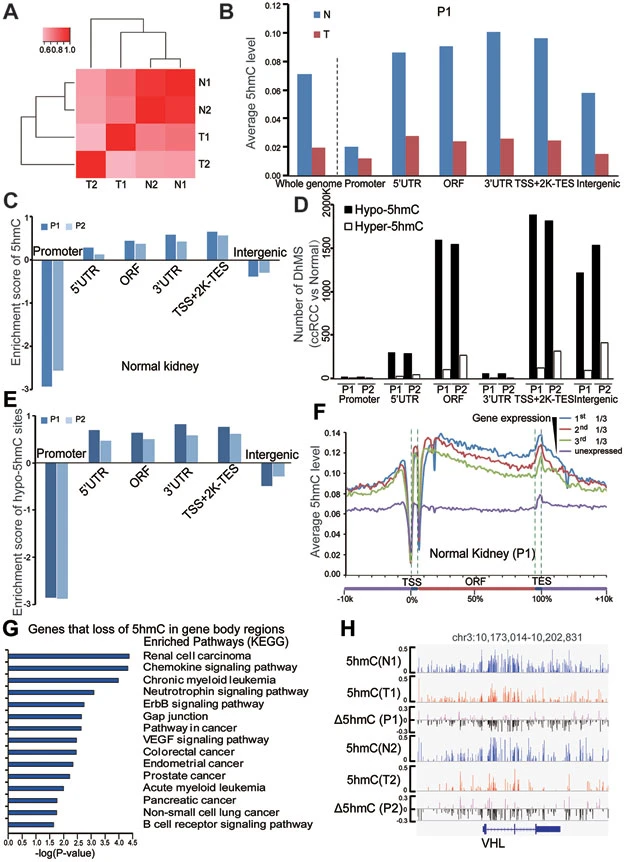
This study conducted bisulfite sequencing (BS-seq) on normal kidney tissues and kidney tumor tissues. The analysis revealed that, compared with the matched normal tissues, there was no genome-wide loss of 5-methylcytosine (5mC) in kidney tumors, while 5-hydroxymethylcytosine (5hmC) was lost across the board in almost all kidney tumor tissues. The level of 5hmC in tumor tissues is an independent prognostic marker for renal cell carcinoma, and the lower the level of 5hmC, the shorter the overall survival period. The loss of 5hmC in tumors is associated with hypermethylation, especially in the gene regions. The research results indicate that the loss of 5hmC, by remodeling the DNA methylation patterns, serves as both a prognostic marker and an oncogenic event in renal cell carcinoma.
Reference:
Chen, K., . Zhang, Z. Guo, Q. Ma, Z. Xu, Y Zhou, Z. Xu, Z. Li,Y. Liu, X. Ye, X. Li, B. Yuan, Y Ke, c. He, L. Zhou, J. Liu and W.Ci (2016).”Loss of 5-hydroxymethylcytosine is linked to genebodyhypermethylation in kidney cancer” Cell Res 26(1): 103-118.